This is an example of one of the most powerful features in Nature’s Pulse. Here you can identify which bars to use for calculation either manually selecting them, or letting Nature’s Pulse select them by price percentage swings, or by number of pivot bars.
Then, Nature’s Pulse calculates combinations between all of the selected bars, and uses your selected parameter file in order to determine where the future turns may occur. By looking at a graphical view of these, you can, at times, see clusters that will pinpoint time windows for possible turning points in the future.
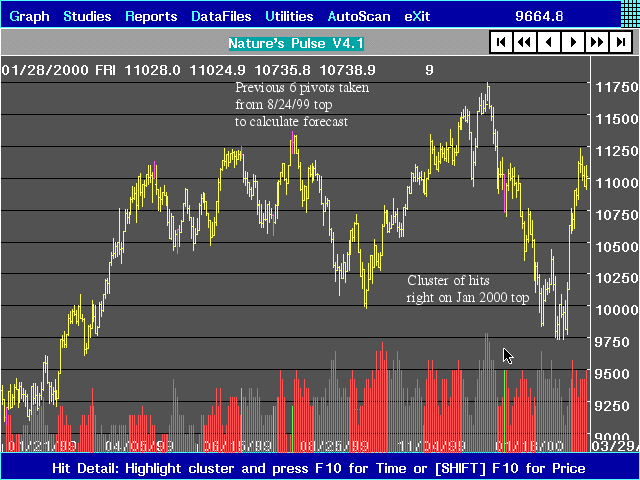
In this example, we selected the top in the Dow Jones on August 24, 1999 and told it to go backwards and select the previous 6 pivot points based on a high or low being the highest or lowest for 15 bars on either side. Then, we applied a parameter file and created the following result. See how the highest cluster of hits occurred directly on the top bar in January, 2000 right at the top of the market! And the previous two peaks, although lower in magnitude, were pretty accurate in calling the times for the double bottoms as well.