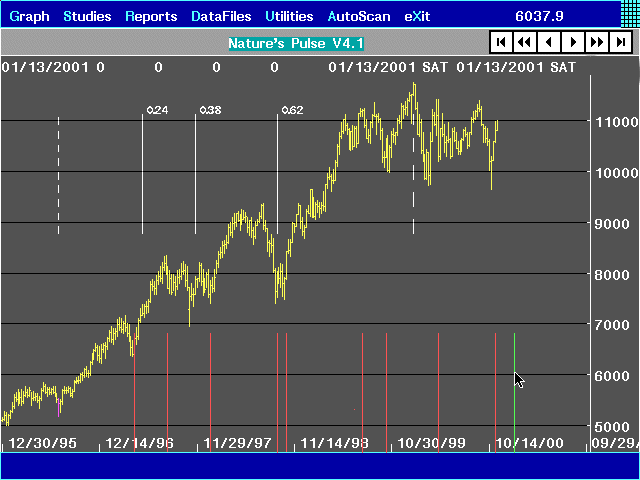
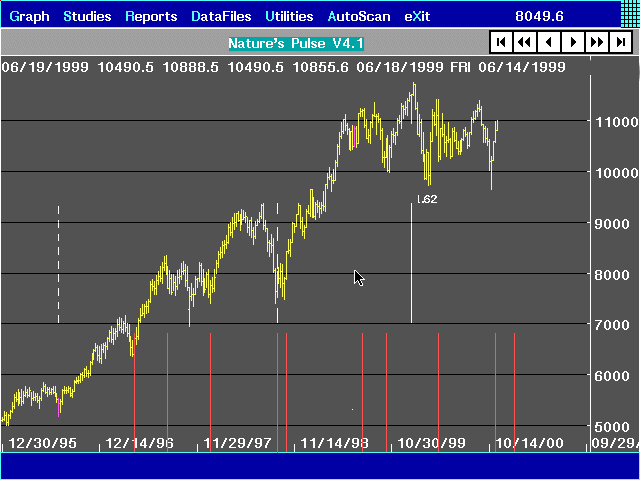
This is an example of the time accordion feature in Nature’s Pulse.
You simply click on the grid in the upper right hand corner. Then, we choose time accordion, tell Nature’s Pulse which parameter file to use, select the beginning point (the left most dotted line), and then we can adjust the second anchor point (right hand dotted line) back and forth in real time using the mouse.
In this example, we taking the time range from the July 1996 low to the Jan 2000 high, and applying a Fibonacci multiplier file which shows how the 38% and 62% timeframes hit.

You could have found the ultimate top while prices were unfolding by applying a cycle from the low to the 62% point as the complete cycle and projecting a multiplier of 1.618 which would have pointed to the ultimate top in Jan 2000 before it happened.

