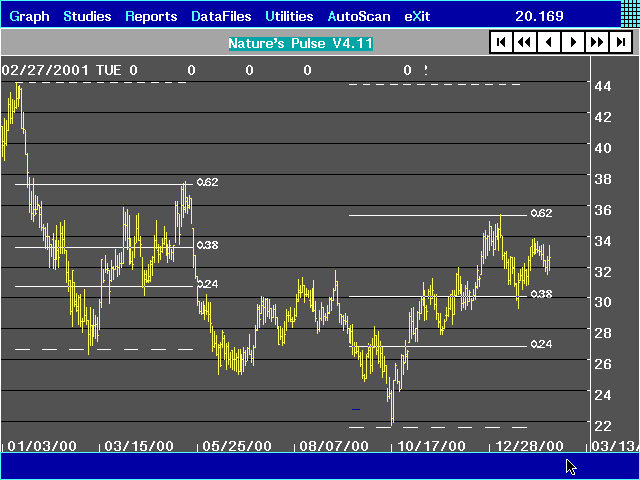
This is an example of the price accordion.
You simply click on the grid in the upper right hand corner. Then, we choose price accordion, select the multiplier file to use, and then anchor the beginning point. When you are setting the second anchor point, the accordion can expand or contract in real time while you are moving the mouse.
Here we have used a chart of Boise Cascade and selected the top on January 13, 2000 as the beginning anchor. We then placed the second anchor on the low at March 7, 2000. The multiplier file we used here was a Fibonacci based file using .382 and .618 retracements. See how the price retraced right to the .618 point on May 17, 2000.
You can also see that we can add more than one accordion to a price chart.
We then started with the same January 13, 2000 top, but this time set the second anchor on the low at October 17,2000. Again, see how Boise is reacting to the .618 retracement in price when it stopped at the high of January 8, 2001.

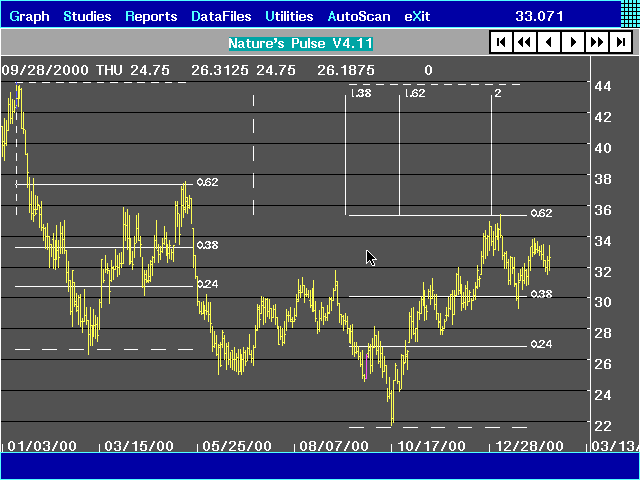
Please note that we can certainly also add TIME accordions as well, making the combination of the two a powerful tool to show future turning points in a time and price window!
Here we have taken the January high and the subsequent low, then also applied a time accordion with the ratios 1.38, 1.62, and 2. Notice yet again how each of the three called a turning point, the 1.38 at the high, the 1.62 at the low, and the 2.
With the time ratio being hit at the same time as the .618 price retracement area coming in, this became a powerful signal that the price would turn at this point.

End of Examples.
