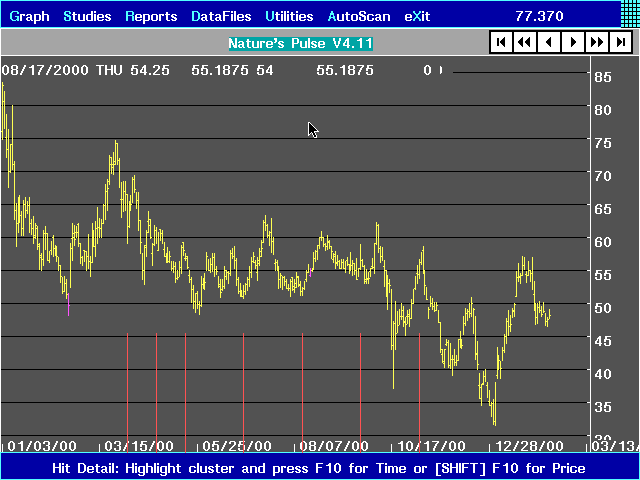
This is an example of the *B* Cycle.
You can select a starting point, then apply a cycle file with multiple cycle lengths of different values to project from that beginning point.
Here we have applied a cycle file with the projections at 30,45,60,90,120,150, and 180 bars to a chart of America Online using the low on February 22, 2000.
Notice how many of the turns are called by this simple, yet powerful projection.

